Debug Django applications
The first steps to correct unexpected behavior in an application are generally to review what you believe are the problematic sections of source code and the corresponding logs. Sometimes though these reviews are fruitless, either because an application has grown in complexity or the unexpected behavior is originating in a not so obvious location.
Under these circumstances, the next step is to start a debugging process with the help of tools to make it easier to detect and fix the problem. In the upcoming sections, I'll describe some of the most popular tools to debug Django applications.
Django shell : python manage.py shell
Just like Python's CLI ('Command
Line Interface') shell where you can evaluate expressions (e.g.
1+3, mystring = 'django'), Django offers its own shell version
through the python manage.py shell command -- where
manage.py is the top level file in every Django
project.
Django's shell is helpful because it automatically loads a project's dependencies and apps, so you're able to evaluate expressions related to your Django project (e.g. queries, methods) without having to go through a tedious set up process. Listing 5-30 illustrates a series of sample expressions run from Django's shell.
Listing 5-30 Django shell sample expressions
[user@coffeehouse ~]$ python manage.py shell
Python 2.7.3
[GCC 4.6.3] on linux2
Type "help", "copyright", "credits" or "license" for more information.
(InteractiveConsole)
>>> from coffeehouse.items.models import *
>>> Drink.objects.filter(item__price__lt=2).filter(caffeine__lt=100).count()
2
>>> from django.test import Client
>>> c = Client()
>>> response = c.get('/stores/1/')
>>> response.content
'<!DOCTYPE html>\n<html....
....
....
<\html>
>>> c.get('/stores/5/')
Not Found: /stores/5/
<HttpResponseNotFound status_code=404, "text/html">
The first snippet in listing 5-30
uses the from import syntax to gain access to a Django
project's model classes, after which queries are made on the models
to validate results. Note there's no need to import additional
libraries or define database connections, all dependencies and
configurations are loaded from the Django project itself.
The second snippet in listing
5-30 uses Django's test library to simulate a client/browser
request to the /stores/1/ and /stores/5/
urls, after which you can inspect the content response or the HTTP
status code (e.g. 404 Not Found). Here again note there's no need
to start a web server or open a browser, you can quickly validate a
Django project's urls and its responses from the Django shell.
Django debug toolbar
The Django debug toolbar offers a more visual experience to debug Django applications compared to the Django shell. The Django debug toolbar offers per page information through a sliding sidebar related to things like resource usage (i.e. time), Django settings, HTTP headers, SQL queries, cache and logging, among other things. Figures 5-2 and 5-3 illustrate a collapsed and non-collapsed screenshot of the Django debug toolbar.
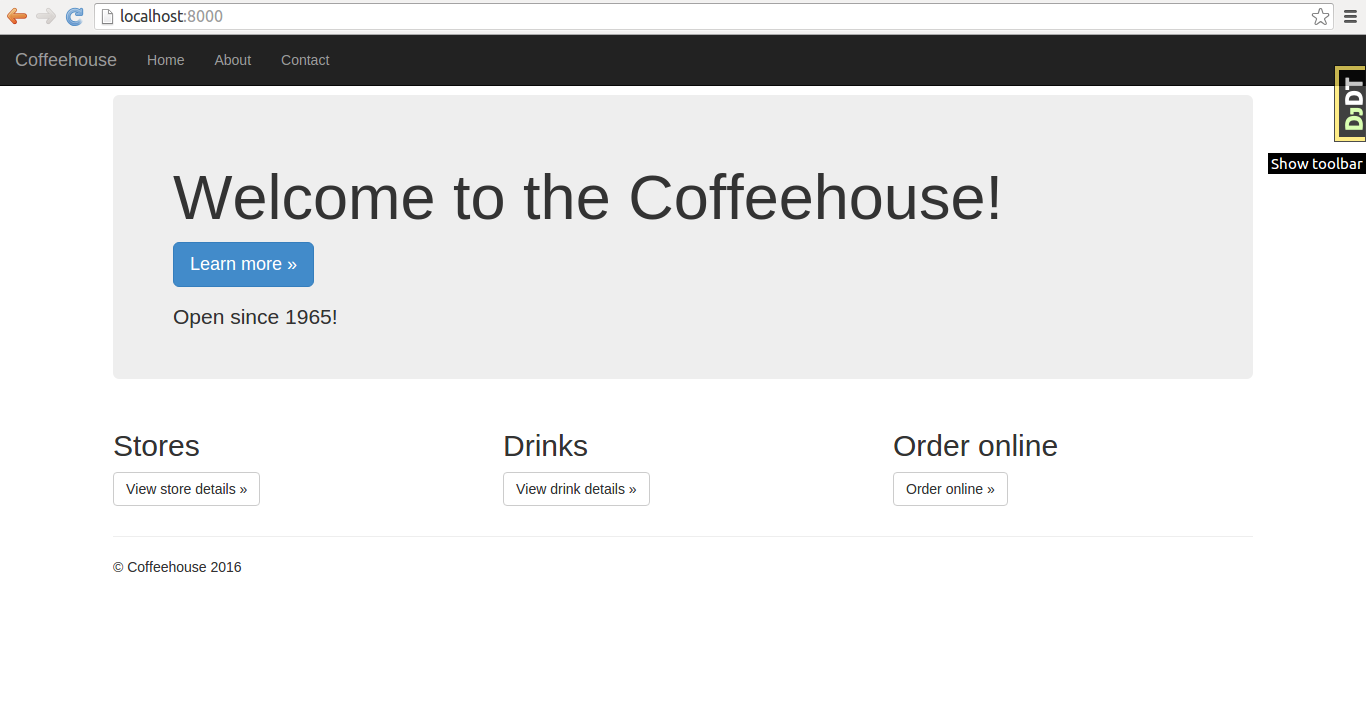
Figure 5-2. Django debug toolbar hidden
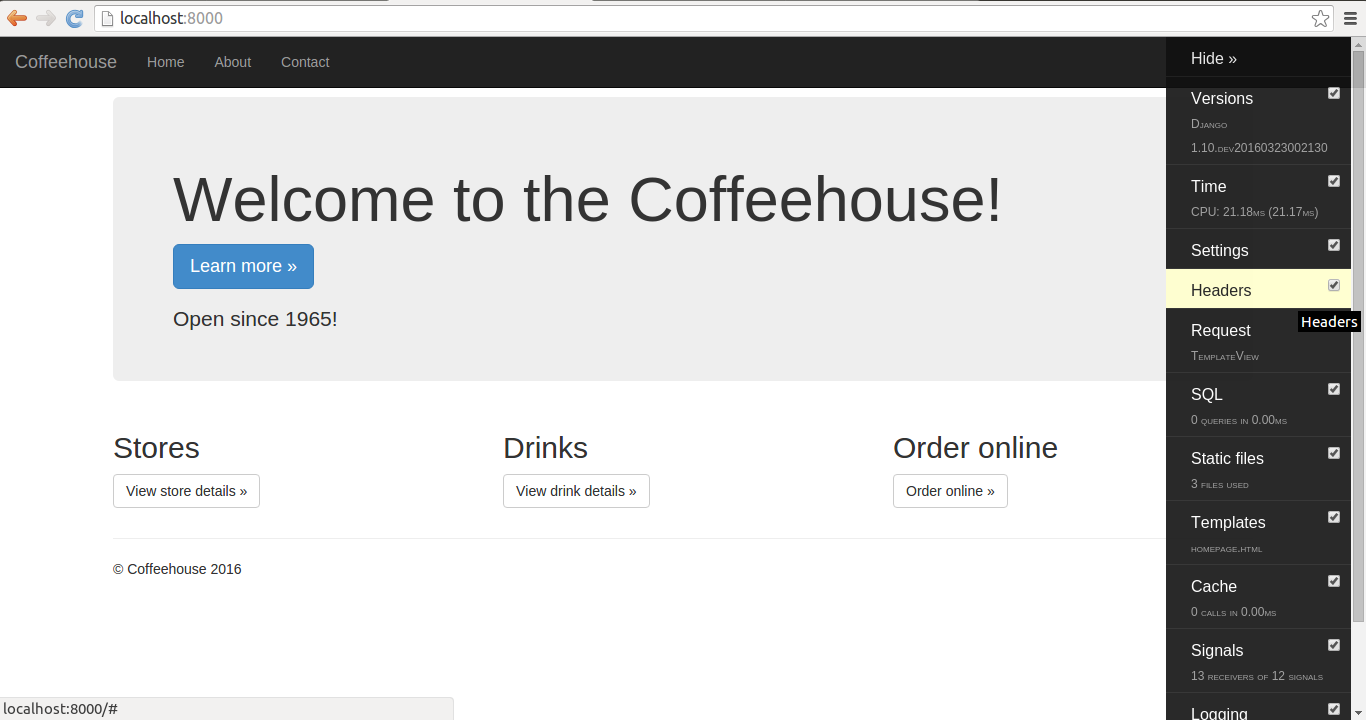
Figure 5-3 Django debug toolbar collapsed
As you can see in figure 5-2, the Django debug toolbar is accessible through a small tab in the top right hand side of every Django project page. Figure 5-3 illustrates a collapsed version of the Django debug toolbar where you can see its various sections, clicking on any of the sections further brings up a pop-window with detailed information about each section.
You can install the Django debug
toolbar with the pip install django-debug-toolbar
command. Once you install the django-debug-toolbar,
you'll also need to add the debug_toolbar line to the
INSTALLED_APPS variable in settings.py so
Django enables the toolbar.
Note The Django debug toolbar only works when a project uses DEBUG=True.
In addition to the UI toolbar,
the Django debug toolbar also offers the debugsqlshell
utility. This utility works like Django's standard shell, but it
outputs the backing SQL associated with any Django model operation,
as illustrated in listing 5-31.
Listing 5-31 Django debugsqlshell sample expressions
[user@coffeehouse ~]$ python manage.py debugsqlshell
Python 2.7.3
[GCC 4.6.3] on linux2
Type "help", "copyright", "credits" or "license" for more information.
(InteractiveConsole)
>>> from coffeehouse.items.models import *
>>> Drink.objects.filter(item__price__lt=2).filter(caffeine__lt=100).count()
SELECT COUNT(*) AS "__count"
FROM "items_drink"
INNER JOIN "items_item" ON ("items_drink"."item_id" = "items_item"."id")
WHERE ("items_item"."price" < 2.0
       AND "items_drink"."caffeine" < 100) [0.54ms]
Note The debugsqlshell is part of the Django debug toolbar, therefore it must be installed as described in the previous paragraphs (e.g.pip install django-debug-toolbarand added asdebug_toolbarto theINSTALLED_APPSvariable insettings.py)
As you can see in listing 5-31,
the debugsqlshell utility is available through the
manage.py command -- just like Django's built-in shell
-- and after you run a Django model operation, it also outputs the
SQL query for the operation.
For detailed information on customizing the Django debug toolbar see its official documentation[10].
Django pdb
pdb -- short for "Python Debugger" -- is a Python core package designed to interactively debug source code. With Python pdb you can inspect the line by line execution of any Python application. To simplify the process of Python pdb in the context of Django applications (e.g. debug request methods) you can use the Django pdb package.
To install Python pdb run
pip install django-pdb and then add
django_pdb to the INSTALLED_APPS variable
in settings.py in the first position -- the position
is important so other Django apps don't override Django pdb's
behaviors (e.g. override runserver and test commands). Be aware the
Django pdb package only works when DEBUG=True.
There are various way to run pdb
with Django, the easiest is to append the ?pdb
parameter to any Django url you want to analyze with pdb. For
example, listing 5-32 shows a debugging sequence for the
http://localhost:8000/drinks/mocha/?pdb url.
Listing 5-32. Django pdb sequence
[user@coffeehouse ~]$ python manage.py runserver
INFO "GET /drinks/mocha/ HTTP/1.1" 200 11716
GET /drinks/mocha/?pdb
function "detail" in drinks/views.py:8
args: ()
kwargs: {'drink_type': u'mocha'}
()
> /python/djangodev/local/lib/python2.7/site-packages/django/core/handlers/base.py(79)make_view_atomic()
-> non_atomic_requests = getattr(view, '_non_atomic_requests', set())
(Pdb) n
> /python/djangodev/local/lib/python2.7/site-packages/django/core/handlers/base.py(80)make_view_atomic()
-> for db in connections.all():
...
...
...
--Call--
> /www/code/djangorecipes/5_django_settings/coffeehouse/drinks/views.py(8)detail()
-> def detail(request,drink_type):
(Pdb)
> /www/code/djangorecipes/5_django_settings/coffeehouse/drinks/views.py(9)detail()
(Pdb) c
You can see listing 5-32 starts
with Django's built-in web server and immediately receives and
dispatches a response to the regular url
/drinks/mocha/. Up to this point everything is
standard, however, notice the next request to the url
/drinks/mocha/?pdb and the verbose output that
follows.
The verbose output tells you
where the request enters the application, including arguments, as
well as the initial entry point into Django's core framework in the
django.core.handlers.base.py package.
After the initial verbose output,
the execution stops at the first (Pdb) instance. At
this juncture you've hit a breakpoint, so the console running
runserver and the requesting client (i.e. browser)
freeze until you provide additional input on the console. In
listing 5-32 you can see the letter n for next is
introduced and the execution moves forward to another line, after
which you'll be presented with another (Pdb) prompt or
breakpoint. At this point, you can just press the
Enter key to re-invoke the previous command (i.e.
n) and move forward.
If you want to advance without
hitting another breakpoint you can type c for continue
so the execution continues normally, without pausing again.
As you can see, the power of pdb with Django lies in the fact that you can walk through the execution cycle of any section in a very granular way, in addition to having the ability to analyze and set variables interactively. Table 5-6 describes the most basic commands related to pdb.
Table 5-6 Python pdb commands used at (Pdb) prompt
| Pdb Command | Description |
|---|---|
| (Enter) (key) | Re-executes the previous command |
| n | Moves execution to the next breakpoint |
| c | Continues execution with no more breakpoints |
| q | Quits the execution immediately |
| p <variable(s)> | Print variable(s) |
| l (L lowercase) | Displays a list of source code at the current breakpoint, 11 lines worth: the breakpoint line, 5 lines prior and 5 lines after. Helpful to provide context. |
| s | Enters a sub-routine. In a non-method related breakpoint, s and n both move to the next breakpoint. In a method related breakpoint, s enters the method or sub-routine. |
| r | Breaks out of a sub-routine. Used after s to return to the main routine. |
In addition to appending the
?pdb parameter to a url to enter pdb in a Django
application, there are two more alternatives. You can append the
--pdb flag to runserver to enter pdb on
every request made to the application (e.g. python manage.py
runserver --pdb). And you can also use the --pm
flag to enter pdb only when an exception is raised in a view (e.g.
python manage.py runserver --pm).
For additional information on pdb itself consult the official Python documentation at https://docs.python.org/3/library/pdb.html. And for additional information on Django pdb, consult the project's documentation at https://github.com/tomchristie/django-pdb.
Django extensions
Django extensions is a collection of tools designed for Django projects. As its name implies, it offers extensions for a wide array of areas where Django's standard tools level off in functionality. For debugging purposes, Django extensions offers two tools that I believe are the most important to explore: runserver_plus and runprofileserver.
To use Django extensions you'll
first need to install it with pip install
django-extensions and then add
django_extensions to INSTALLED_APPS in
settings.py. Once you setup Django extensions, its
various tools become available through the python
manage.py command just like Django's standard tools.
The Django extensions
runserver_plus command offers interactive and enhanced
debugging for Django projects. To use runserver_plus
you'll first need to install the Werkzeug utility -- pip
install Werkzeug. Once you install Werkzeug, simply start a
Django application with python manage.py
runserver_plus instead of Django's standard python
manage.py runserver. At first glance the
runserver_plus command works just like Django's
runserver, however, if you happen to hit an exception
you'll see error pages like the ones in figures 5-4 and 5-5.
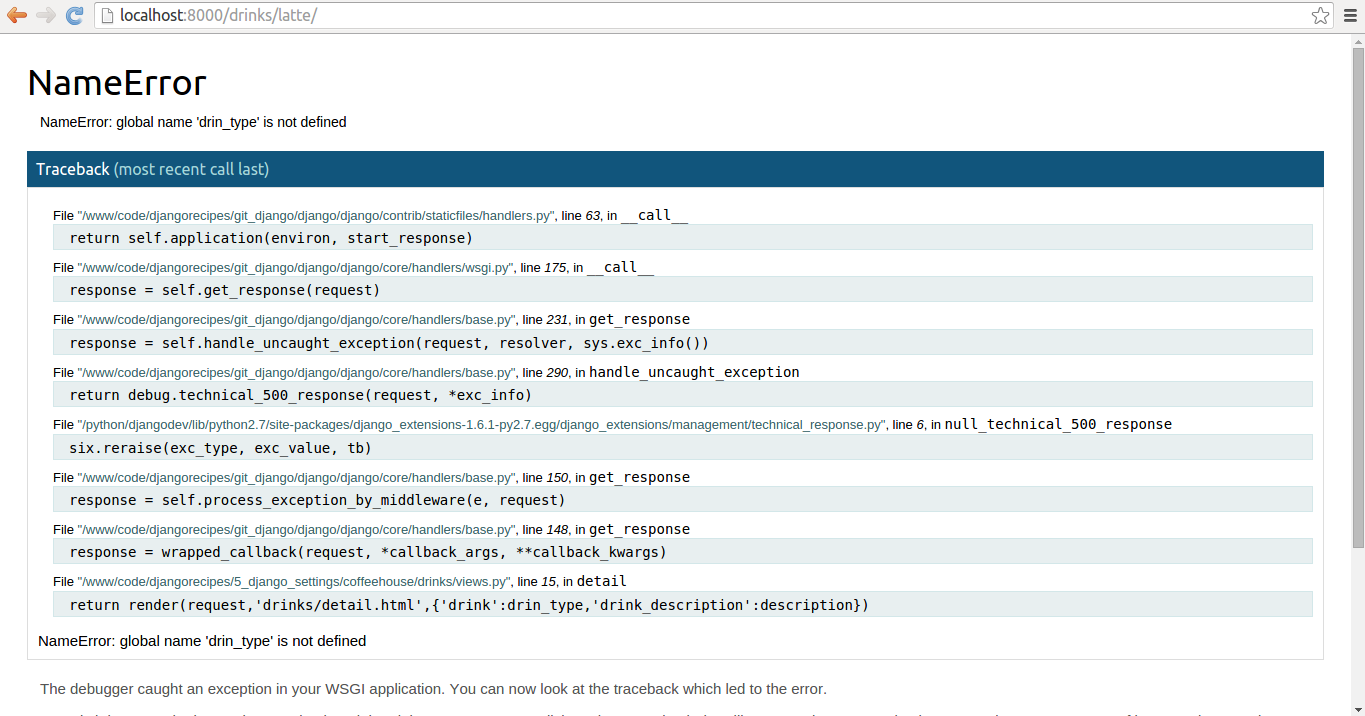
Figure 5-4. Django extensions runserver_plus
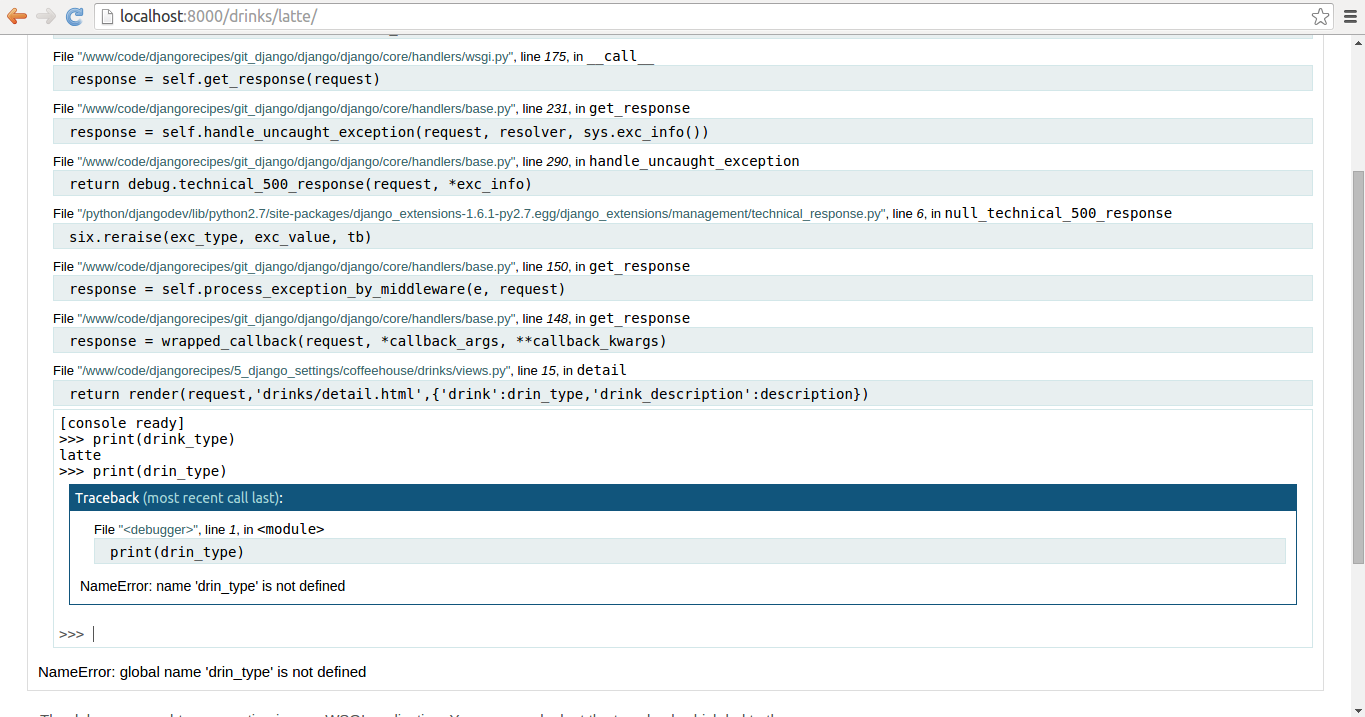
Figure 5-5. Django extensions runserver_plus with interactive console
In figure 5-4 you can see a slightly different Django exception page vs. Django's default exception page. This different layout is generated by Werkzeug, but the layout itself isn't what's interesting about this approach, if you hover over any section of the stack trace you can start an interactive debugging session, as illustrated in figure 5-5. This is a much simpler and powerful debugging approach because it's done directly in a browser!
Another powerful Django
extensions tool is runprofileserver which can create a
Python cProfile for a Django application page. A Python cProfile
provides a set of statistics that describes how often and for how
long the various parts of a program are executed, which can be
helpful to determine solutions for slow loading and resource
intensive Django application pages.
The first thing you'll need to do
to use runprofileserver is create a folder to hold the
profile files (e.g. mkdir
/tmp/django-coffeehouse-profiles/). Next, simply start a
Django application with python manage.py runprofileserver
--use-cprofile --prof-path=/tmp/django-coffeehouse-profiles/
instead of Django's standard python manage.py server
-- note the --prof-path flag value points to the
directory that will hold the profile files.
Open up a browser, head over to
the Django application and navigate through it. If you open the
folder that holds the profile files, you'll see files like
root.000037ms.1459139463.prof,
stores.000061ms.1459139465.prof and
stores.2.000050ms.1459139470.prof, where each file
represents a cProfile for each page hit.
Although it would go beyond the
scope of the book to dive into cProfile analysis, not to mention
there are many tools available for this purpose, if you wan't a
quick and easy tool to open Python cProfile files, I would suggest
SnakeViz. Just do pip install snakeviz and then run
snakeviz <file_name>. Once you run
snakeviz on a file, you'll see Python cProfile details
like the ones illustrated in figures 5-6 and 5-7.
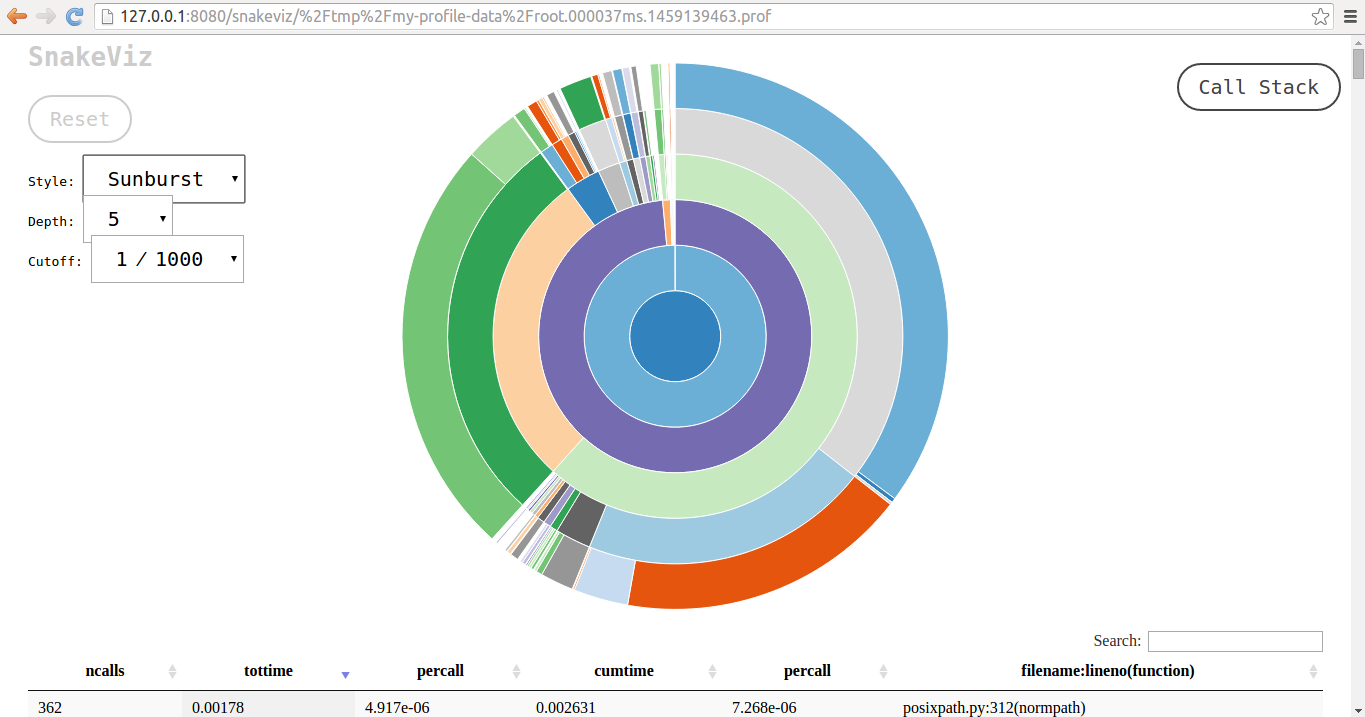
Figure 5-6. SnakeViz cProfile image
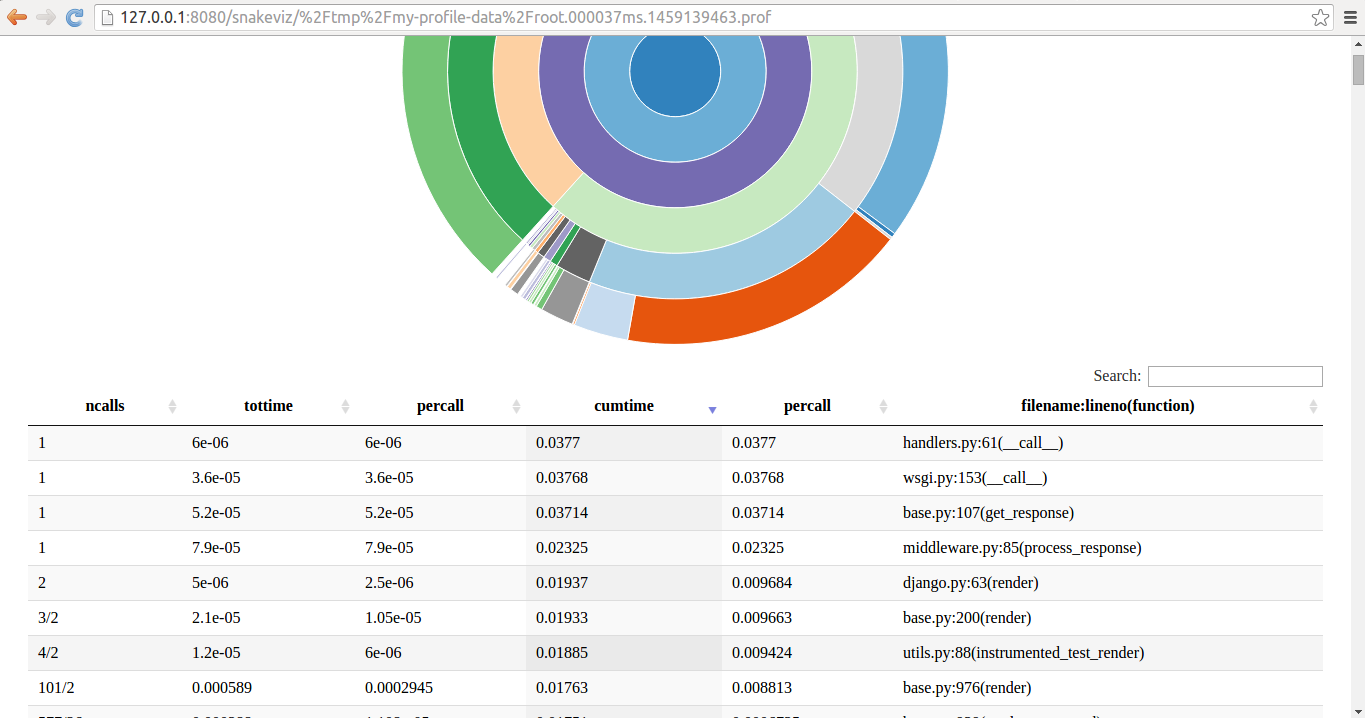
Figure 5-7. SnakeViz cProfile listing sorted by run time
As I mentioned at the start,
Django extensions provides many tools in addition to
runserver_plus and runprofileserver which
I believe are the most appropriate for debugging tasks.
Nevertheless, I would recommend you review the Django extensions
documentation available at https://django-extensions.readthedocs.org/en/latest/ to explore
other tools that might be of use in your own projects (e.g. the
show_urls tool displays a Django project's url routes and the
graph_models tools generates graphs for a Django project's
models).