Tech Ads
Back to Article List
Originally published March 2004 [ Publisher Link ]
JFreeChart : Data driven graphics with Java
Graphics are often a better choice for displaying tabular data on a Web site than simple text. Unfortunately, the generation of graphics normally implies the use of a separate application like the GIMP or Photoshop. This is cumbersome for simple images and practically impossible when graphics need to be generated from data that changes often. A good solution to the problem is JFreeChart, an open source Java library that allows you to generate images directly from your application code.
Download JFreeChart and unpack it into a temporary directory. Since JFreeChart is only a library, you need to place its binaries on your CLASSPATH so your Java applications can make use of it. The jfreechart.jar file directly under the package distribution and the jcommon.jar package under the lib directory are the two archives you need to compile and execute your graphic-generating code.
Let's design a vanilla Java class to generate a JPEG graphic via the JFreeChart classes -- in this example, an ordinary XY chart:
import org.jfree.chart.*;
import org.jfree.data.*;
public class TheFuture {
public static void main(String[] args) {
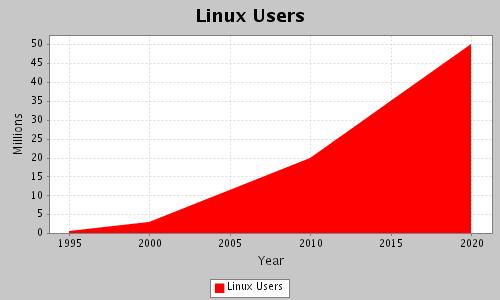
XYSeries series = new XYSeries("Linux Users");
series.add(1995, 0.5);
series.add(2000, 3.0);
series.add(2010, 20.0);
series.add(2020, 50.0);
XYDataset dataset = new XYSeriesCollection(series);
JFreeChart chart = ChartFactory.createXYAreaChart(
"Linux Users",
"Year",
"Millions",
dataset,
org.jfree.chart.plot.PlotOrientation.VERTICAL,
true,
false,
false);
try {
ChartUtilities.saveChartAsJPEG(
new java.io.File("TheFuture.jpg"), chart, 500, 300);
} catch (java.io.IOException exc) {
System.err.println("Error writing image to file");
}
}
}
|
In this code, we first import JFreeChart's classes, followed by the typical class definition and main method used on every terminal based Java application. Next, we create an instance of the XYSeries class on which we will later assign our data records through the add() method. The inputs for this method are the X and Y coordinates for each point to be plotted on the image. We then define an XYDataSet object which is instantiated with the XYSeries class we just created.
Further down we create a JFreeChart reference, which will contain the results of executing the static method createXYAreaChart on the ChartFactory class. The input we provide on this method includes the title for the chart, the data represented on the X axis followed by the Y axis title, the dataset to be plotted (in the form of an XYDataSet instance), the orientation of the graphic, and three boolean values which represent the possible inclusion of the graphic legend, tooltips, and URLs respectively.
Finally, we define a try/catch block that contains the invocation of the saveChartAsJPEG function, which is in charge of doing the actual writing of the graphic to a JPEG file. As noted in the code, the generated image will be saved as TheFuture.jpg from the chart object and will be 500x300 pixels in size, as shown here.
This example barely scratches the surface of JFreeChart's capabilities. The library is also capable of generating a wide range of images like bar charts, Gantt charts, and time series charts, among others.
To design a class to generate a pie chart which we then output to a PNG graphic we can use the following code:
import org.jfree.chart.*;
import org.jfree.data.*;
public class Distros {
public static void main(String[] args) {
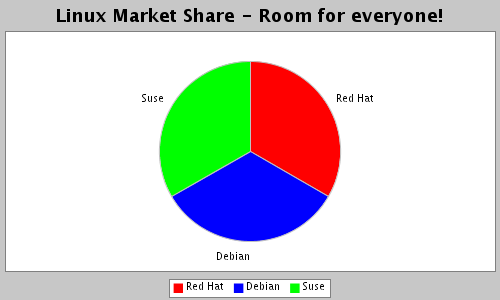
DefaultPieDataset pieDataset = new DefaultPieDataset();
pieDataset.setValue("Red Hat", new Integer(33));
pieDataset.setValue("Debian", new Integer(33));
pieDataset.setValue("Suse", new Integer(33));
JFreeChart chart = ChartFactory.createPieChart
("Linux Market Share - Room for everyone!",
pieDataset,
true,
true,
true);
try {
ChartUtilities.saveChartAsPNG(
new java.io.File("Distros.png"), chart, 500, 300);
} catch (java.io.IOException exc) {
System.err.println("Error writing image to file");
}
}
}
|
As you can see, the code is very similar in nature to our first example. We make use of the org.jfree.data and org.jfree.chart packages, and again define a dataset, although for this case in the form of a DefaultPieDataSet class. We populate a JFreeChart instance through the same ChartFactory class, but using the variant createPieChart method. Finally, we again use the CharUtilities class to write our image to the file system, but instead of using saveChartAsJPEG we use saveChartAsPNG, which takes similar input data and produces this graphic.
Thus far we have covered the creation of graphics on standalone Java classes. JFreeChart can be used in JSP and servlet environments as well, through Cewolf, which allows you to create on-the-fly graphics for Java Web applications.
With JFreeChart and Cewolf you can generate graphics directly from your code without using any third-party graphic application.